1.
a)
Integer is a data type that consists of whole numbers ranging from -32,768 and +32,767.
Byte data types are whole numbers ranging from 0 to 255. This requires half the amount of space as integer data.
Real Number data types don’t need to be whole numbers. This requires double the amount of space as integer data but can represent values from -1 x 10^37 to +1 x 10^37 with up to 7 significant figures.
b)
ASCII is the American Standard Code for Information Interchange and is one of the earliest coding standards for digitizing the alphabet, numbers and symbols.
UNICODE is the Universal Coded Character Set which allows for more symbols and languages to be coded.
ASCII is more common because it requires less bytes and takes up less space.
c)
Quantitative bipolar palettes are used for showing 2 distinct values which can be represented by 2 color groups. An example of this would be a map that is showing areas that are public property vs private property.
Quantitative ramp palettes are good for showing the continuous change of a variable over an area. An example of this would be a map showing elevation as different colours.
Qualitative palettes are used to represent values with distinct attributes. An example of this would be a map that is classifying the different types of trees within a forest.
2.
a)
A quantile is a set of data that is split into equal sized groups. This is useful because it allows a linear scale between data values. With quantiles each group can be divided equally, and it makes highly skewed distributions look better. For a map that is showing census data or age distributions this can be advantageous to use.
b)
Boston has the highest population in the year 2000 (588,957 people).
c)
The town with the greatest area in 1980 is Plymouth and it contained 38,384 people.
3.
a)
There are 251 towns in total. 249 towns had a population change greater than 0 between 1980-1990 and 1990-2000.
b)
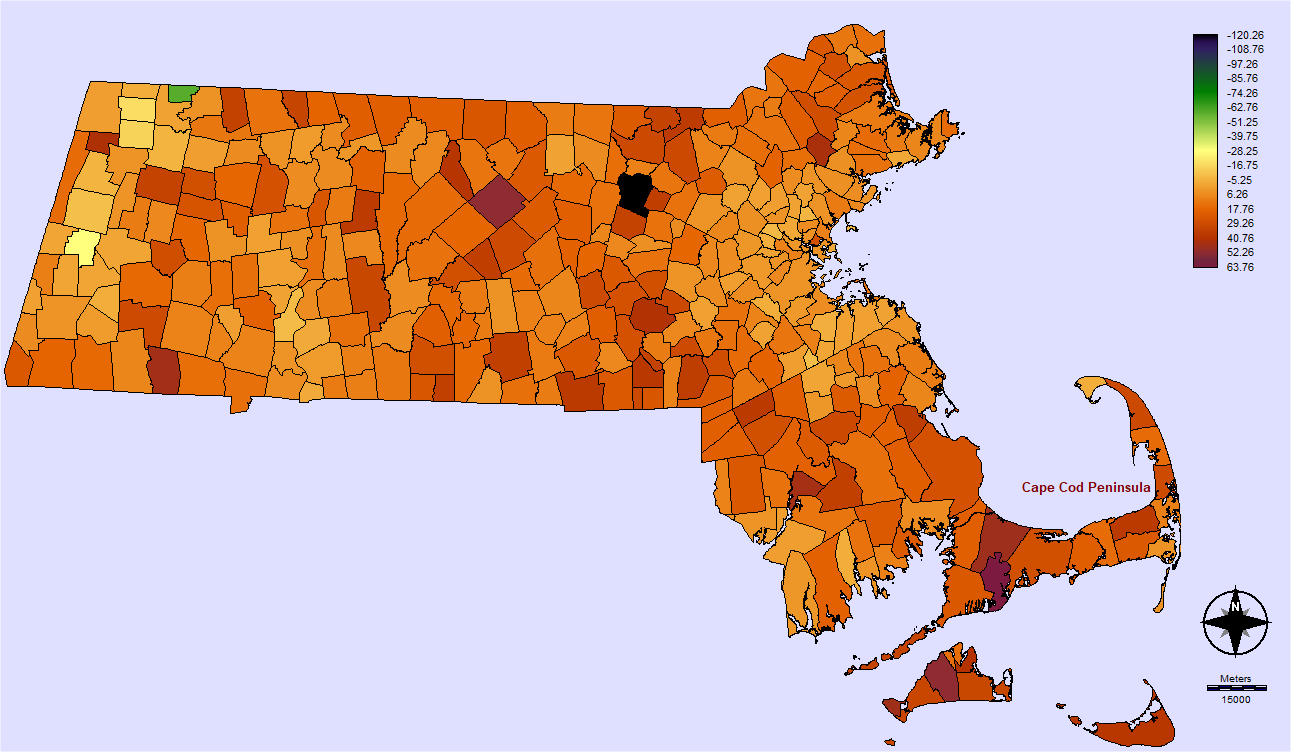
This is the growth rate of each town between 1980 and 2000. The unit of measurement is in percent.
c)
Harvard experienced the most population decline from 1980 to 2000. The decline in population could be a result of the Fort Devens military base closure in 1996 which sent soldiers and their families elsewhere.
d)
Massachusetts growth rate from 1980 to 2000
e)
There are 145 hospitals and 2521 schools within Massachusetts.
f)
Boston experienced the most growth between 1990 and 2000. During these years Boston was converting much of their land from factories to residential suburbs, which explains the population growth.
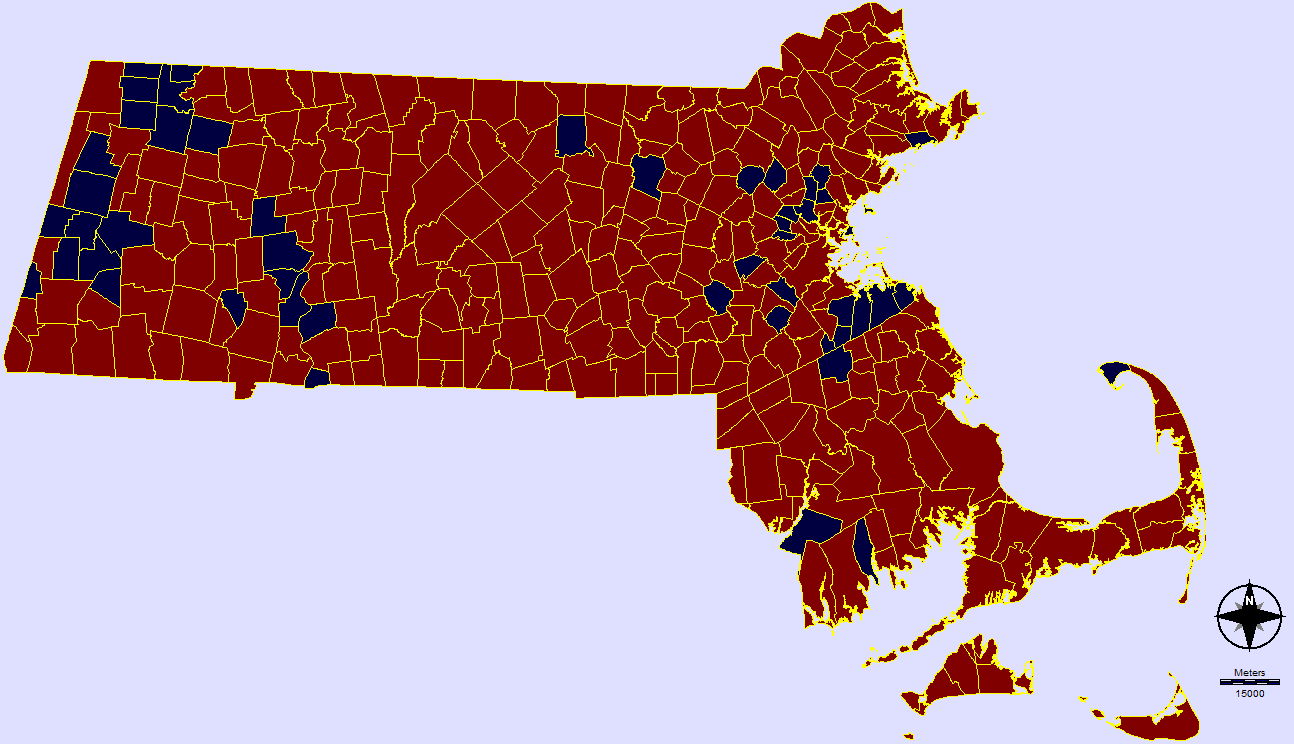
g)
Positive vs Negative population growth in Massachusetts (1980-2000)