1.
d)
The geographic coordinate system used is the EPSG Code 4326 on the WGS 84 ellipsoid.
e)
The resolution of the image is 0.00027777778 decimal degrees.
111,319.9 X 0.00027777778 = 30.92. This represents roughly 31m.
The extent is from a min X value of -125.0001389 to a max X value of -123.9998611 and a min Y of 47.9998611 to a max Y of 49.0001389.
2.
a)
A qualitative color palette would not be appropriate for this DEM because it would assign an individual attribute to each elevation value where each value is discrete from the ones next to it. A quantitative palette is better because it assigns values along a gradient of low to high for the elevation values.
b)
Elevation Values around the Strait of Juan de Fuca
The color palette is quantitative because elevation values are best displayed on a continuous gradient of low to high
3.
a)
Raster data covers the surface of the world with a matrix of cells, where each call has its own attribute. Vector data is points, lines, and polygons that display geographical information. These files are generally smaller than raster because they contain less data.
b)
Raster data is best when creating elevation maps. The data varies continuously, and it can cover large areas which makes it better than vector for this.
Vector data is best when creating discrete boundaries or when delineating specific land-forms such as rivers. Area borders and rivers can have irregular shapes often with curved lines which is hard for raster data to display.
4.
a)
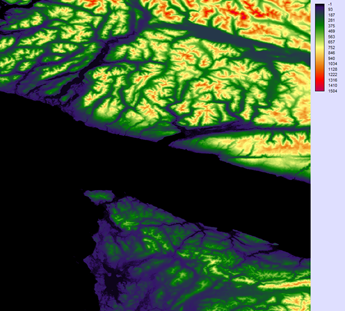
The minimum value is -1 and the maximum value is 1504.
b)
5.
a)
b)
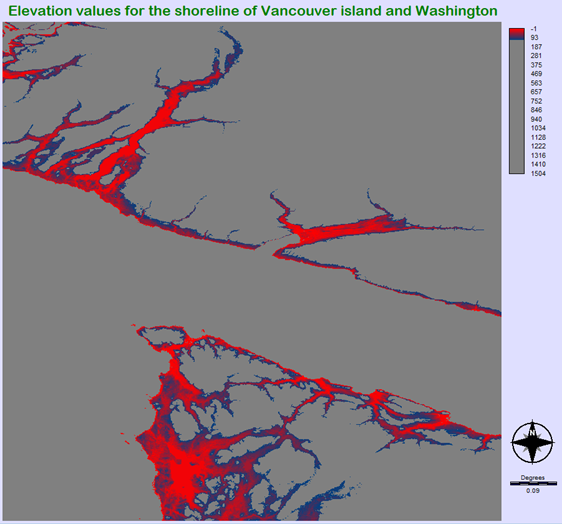
The resulting map shows the elevation values around the Strait of Juan de Fuca. On the north part is British Columbia’s Vancouver Island and on the south is Washington’s Olympic National Park. The problem with this map is that the water bodies and land masses are both assigned as grey. This makes it difficult in comprehending the map, however it is still useful. The parts of land near sea level are shown very prominently which can be valuable in evaluating risk of sea level rise.
6.
a)
The raster group file (.rgf) is a collection of raster layers and is primarily used to create tabular summaries about the characteristics of any location. The vector link file (.vlx) is used to establish a connection between a vector spatial frame and a database table that contains the information for a set of attributes. An environmental file (.env) holds and stores user preferences within the software.
b)
An ESRI shapefile is a vector data storage format used to store the geometric location and attribute information of geographic features. Shapefiles are generally, city locations, road networks, and country boundaries.
An ESRI grid is the raster data storage format and is divided into two types of grids. Integer grids are used to represent discrete data which is good for looking at things like land-use type. Floating-point grids are used to represent continuous data which are good for things like elevation.
c)
The GIS question I have is “how is Google using GIS in their autonomous driving vehicles and what is their future plans?”
Autonomous cars use a mix of LiDAR sensors and GIS technology. LiDAR sensors are used to detect the surroundings 360o around the car and feed information into a machine learning algorithm. This machine learning algorithm helps detect objects on the road and guide the car safely. By using GIS maps autonomous cars are safer and faster at getting you to your destination. For example, if heavy snow is covering the lane markings the car can use its GPS to get to its destination. GIS also helps cars get to their destination faster by avoiding traffic. Google is currently collecting huge amounts of data on real-time traffic data and historical traffic patterns. Their future plans are to optimize routes for customers and provide infrastructure benefits so cities and continue developing. With the recent advancements in GIS autonomous cars will become more common on the road and Google will surely profit.
